Monthly US Robocall Report · Preliminary edition, data through 2026-09-22
Robocalls in America: September 2026
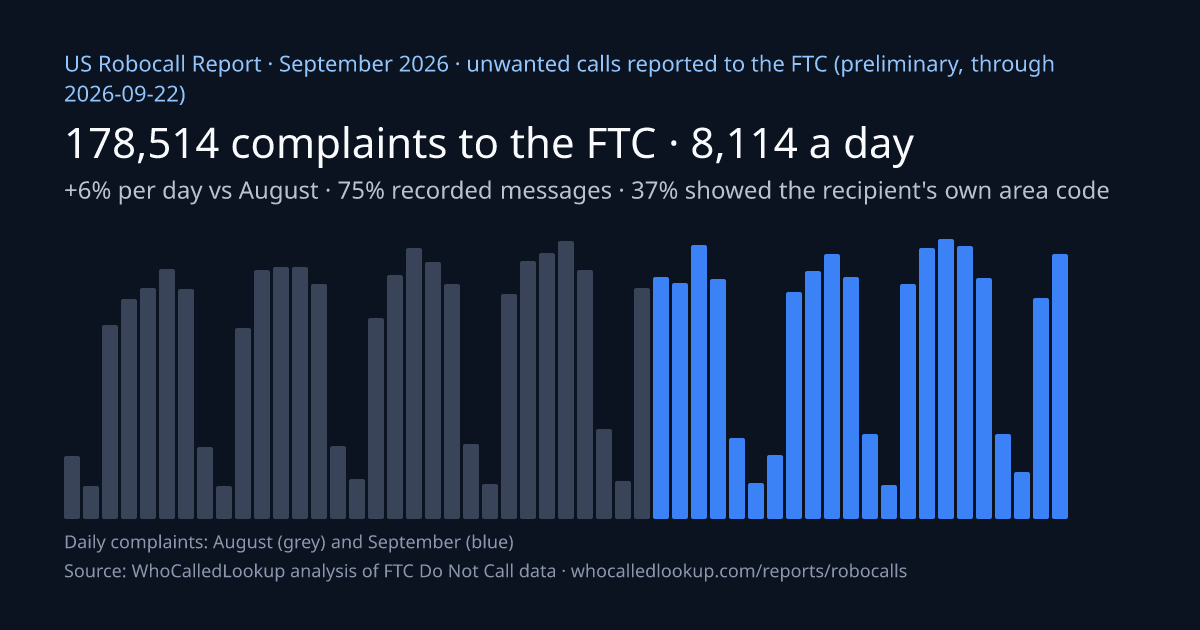
Americans filed 178,514 complaints with the FTC's Do Not Call Registry in September 2026 (through 2026-09-22), about 8,114 a day, 6% more per day than in August.
The FTC publishes complaints a weekday at a time, so this edition covers 22 days. Daily rates are used for comparisons. A final edition replaces it at this address once the month is complete.
Key findings
- Americans filed 178,514 complaints with the FTC's Do Not Call Registry in September 2026 (through 2026-09-22), about 8,114 a day, 6% more per day than in August.
- Debt reduction calls were the most common named complaint, at 25.9% of all reports; 91% of them were recorded messages.
- 75% of consumers who answered the question said the call was a robocall (a recorded message).
- 37% of the calls reported showed the complainant's own area code on the caller ID, the signature of neighbor spoofing.
- The complaints named 154,883 different phone numbers.
- 10.6% of the month's complaints fit 4 statistically detected campaigns that cycle through thousands of numbers; the largest used 6,850 numbers.
- California residents filed the most complaints (18,911).
- Per resident, Nebraska was hit hardest: 119.5 complaints per 100,000 people (30-day rate).
- Among states with at least 500 complaints, Nevada rose fastest: +48% per day on August.
National trend
8,114 FTC complaints a day in September 2026, against 7,661 a day in August 2026 (237,504 over 31 days). The complaints named 154,883 different numbers and came from consumers in 54 states and territories. The FCC, which takes far fewer complaints, logged 4,023 unwanted-call complaints over the same days (182.9 a day, +11% on August 2026). 17% of FTC complaints were about toll-free numbers.
Top scam and robocall types
The subject consumers picked when reporting to the FTC. “Other” and “No subject” are what the FTC form records when no category fits or none was chosen.
| Subject | Complaints | Share | Share in August | Recorded |
|---|---|---|---|---|
| Other / unspecified | 67,994 | 38.1% | 38.9% | 71% |
| Debt reduction | 46,170 | 25.9% | 22.9% | 91% |
| Impostor (government, business, family) | 19,361 | 10.8% | 11.4% | 69% |
| Dropped call / no message | 14,092 | 7.9% | 7.9% | 61% |
| No subject given | 11,519 | 6.5% | 7.3% | 79% |
| Medical & prescriptions | 10,028 | 5.6% | 6.4% | 78% |
| Warranties & protection plans | 2,382 | 1.3% | 1.4% | 60% |
| Home improvement & cleaning | 2,260 | 1.3% | 1.3% | 38% |
| Vacation & timeshares | 1,130 | 0.6% | 0.6% | 54% |
| Lotteries, prizes & sweepstakes | 888 | 0.5% | 0.5% | 33% |
| Energy, solar & utilities | 820 | 0.5% | 0.5% | 34% |
| Computer & tech support | 767 | 0.4% | 0.4% | 60% |
Most complaints, by state
- California18,911+14%
- Florida18,126-1%
- Texas14,925+5%
- Illinois8,265+10%
- Pennsylvania7,350+6%
- Georgia6,764+7%
- Michigan6,184+11%
- New York6,068+9%
- Ohio5,584-3%
- Arizona5,515+22%
Totals are raw. Change is per day against August 2026; † means a concentrated single-town source is left out of the change (see methodology).
Most complaints per resident
- Nebraska119.5per 100K
- Nevada108.1per 100K
- Florida105.8per 100K
- Oklahoma100.5per 100K
- Arizona99.2per 100K
- Tennessee97.6per 100K
- Illinois88.7per 100K
- Washington, DC87.2per 100K
- Michigan83.2per 100K
- Georgia82.5per 100K
30-day rate per 100,000 residents (Census 2024 estimates); states with 300+ complaints.
Fastest-rising states
Per-day change against August 2026, ranked only among states with 500+ complaints this month and 10+ a day in both months, after leaving out concentrated single-town sources. WV: Morgantown, WY: Cheyenne, RI: Coventry, IN: Osecola, KS: Salina were left out.
Local area codes shown most
Notable campaigns
Statistical groupings of many numbers that drew the same complaint in the same pattern. They don't identify who is calling. Method.
- Debt-relief robocall campaign on toll-free numbers11,672 complaints this month from 6,850 numbers (6.5% of all)
- Debt-relief robocall campaign on local numbers7,033 complaints this month from 6,385 numbers (3.9% of all)
- Medical and prescription robocall campaign on local numbers145 complaints this month from 135 numbers (0.1% of all)
- Medical and prescription live-caller campaign on local numbers122 complaints this month from 121 numbers (0.1% of all)
For journalists
Quote any figure on this page with credit. The chart is free to embed.
Suggested citation
WhoCalledLookup. "US Robocall Report: September 2026 (preliminary)." https://whocalledlookup.com/reports/robocalls/2026-09. Analysis of FTC Do Not Call and FCC consumer complaint data, published 2026-09-25, corrected 2026-09-25.
Embed the chart
<a href="https://whocalledlookup.com/reports/robocalls/2026-09"><img src="https://whocalledlookup.com/reports/robocalls/2026-09/chart.png" width="1200" height="630" alt="Daily FTC unwanted-call complaints, September 2026" style="max-width:100%;height:auto"></a>
<p>Source: <a href="https://whocalledlookup.com/reports/robocalls/2026-09">WhoCalledLookup US Robocall Report, September 2026</a>, from FTC Do Not Call data.</p>
Chart image: 1200×630 PNG.
Press contact
Methodology and sources
- FTC figures count complaints the FTC received between 2026-09-01 and 2026-09-22 (22 days), from its daily Do Not Call files. They are unverified consumer reports of calls that displayed a number; caller ID is often spoofed.
- Comparisons with August 2026 use complaints per day, so a partial month compares fairly.
- “Recorded message” shares count only consumers who answered the FTC's robocall question. “Own area code” means the calling number's area code matched the complainant's.
- States are where the complainant lives. Per-resident rates use Census Bureau 2024 population estimates, scaled to 30 days.
- Concentrated sources. The FTC file has no filer ID, but it records the complainant's town and the area code of their own phone. A town + phone area code that supplies 10%+ of a state's complaints and either files at 3× its previous daily rate (while filing more per resident than 2× the state average) or files 5× the state's per-resident rate is treated as one or a few very active filers. Totals keep these complaints; growth and per-resident rankings leave them out, and growth rankings need 500+ complaints and 10+ a day in both months. This month: Morgantown, WV (806 phones): 477 complaints, 45% of the state, up from 0; Cheyenne, WY (307 phones): 94 complaints, 36% of the state, up from 8; Coventry, RI (401 phones): 80 complaints, 20% of the state, up from 12; Osecola, IN (574 phones): 316 complaints, 12% of the state, up from 89; Salina, KS (785 phones): 204 complaints, 12% of the state, 7.9× the state's per-resident rate.
- Headline check: without the flagged sources (1,171 complaints, 0.7% of the total), the national per-day change would be +5%, the top named subject's share 26%, the recorded-message share 75% and the own-area-code share 36%.
- Campaigns: prefix blocks with 10+ numbers sharing one subject (70%+) at 5×+ the usual density, grouped by subject, number type and call style over the 60 days to the report date, listed only when they have 50+ numbers, no single town + phone area code supplying 25%+ of the complaints, and every other test on the campaigns page.
- First published 2026-09-25. This snapshot was generated 2026-09-25 15:52 UTC and won't change until the final edition replaces it; any correction is noted at the top.