US Spam-Call Data Pack: FTC Complaint Charts and CSV Downloads
683,247 unwanted-call complaints about 579,489 phone numbers, July 24, 2026 to October 20, 2026, as five charts and five CSV files you can download, with the method and the limits spelled out. Edition 2026-10.
Published 2026-10-27 · By Andrew Pickett, OmegaIT · Source: FTC Do Not Call reported calls data set · Press page and citation lines
What the data shows
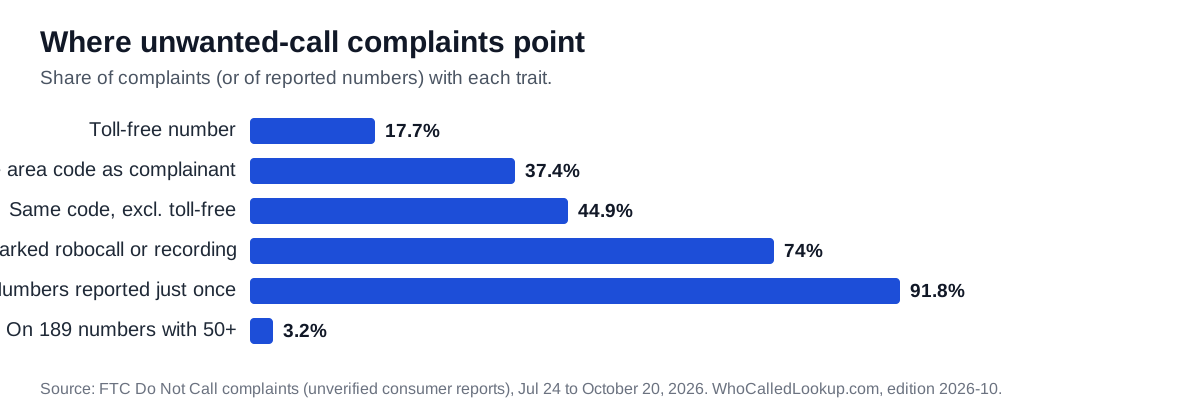
- Toll-free prefixes lead. 17.7% of complaints name a toll-free number, and 833 alone is 3.9% (26,873 complaints).
- Numbers are mostly one-offs. 91.8% of reported numbers were reported once; only 189 numbers were reported 50 or more times, and they account for 3.2% of complaints.
- Local look-alikes are the common pattern. In 37.4% of complaints (44.9% excluding toll-free) the reported number has the same area code as the complainant's own phone.
- Area-code rankings are fragile. 2 of the ten geographic codes with the most complaints get 25% or more of them from one city-and-own-code group (813, 405).
- State rates depend on single sources too. Nebraska has the highest rate, 325 complaints per 100,000 residents; without its largest single source it is 228, and Florida leads on that basis.
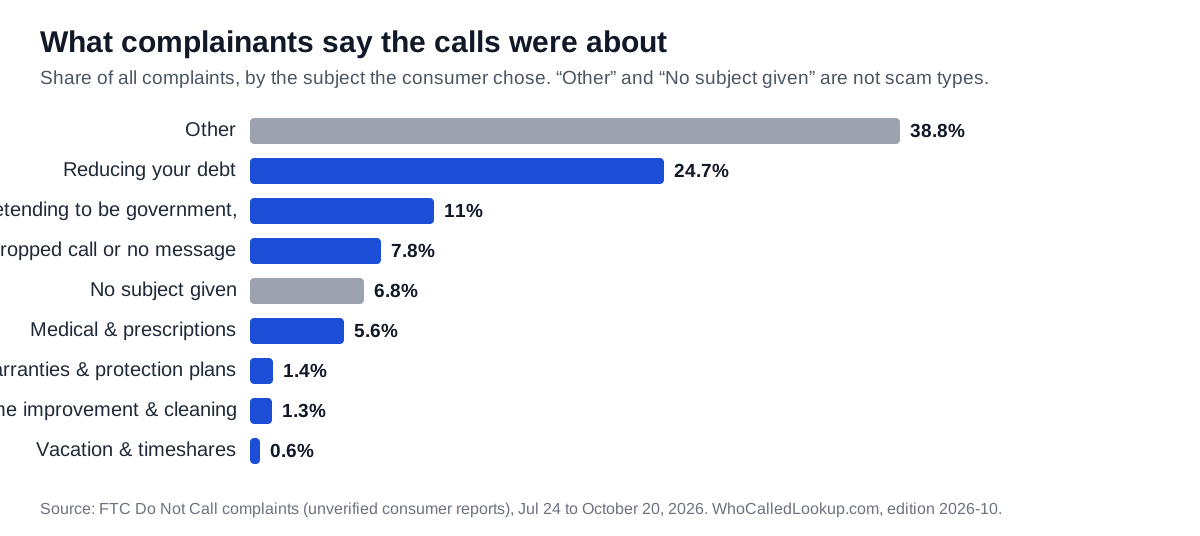
- The largest named subject is reducing your debt at 24.7% of complaints; the unspecific “Other” is bigger still at 38.8%.
Downloads
Every file carries the edition and date window in its columns, so it stays self-describing when it leaves this page. CSVs use UTF-8, a header row and CRLF line ends.
| File | What it holds |
|---|---|
| spam-calls-2026-10-area-codes.csv | Complaints by area code (every prefix in the file) |
| spam-calls-2026-10-states.csv | Complaints by the complainant's state, per 100,000 residents |
| spam-calls-2026-10-subjects.csv | Complaints by subject the consumer chose |
| spam-calls-2026-10-weekly.csv | Complaints by week |
| spam-calls-2026-10-call-hours.csv | Complaints by hour of the recorded call time |
| spam-calls-2026-10-top-area-codes.svg | Chart: area codes with the most complaints |
| spam-calls-2026-10-states-per-100k.svg | Chart: states by complaints per 100,000 residents |
| spam-calls-2026-10-subjects.svg | Chart: complaint subjects |
| spam-calls-2026-10-weekly.svg | Chart: complaints per day, by week |
| spam-calls-2026-10-key-shares.svg | Chart: toll-free, own-code, repeat and robocall shares |
Area codes with the most complaints
The twelve geographic area codes with the most complaints, with a grey bar where one city-and-own-code group supplies 25% or more. The full list, with all 752 prefixes in the file, is in the area-codes CSV. Our article on which area codes are scams explains why a high count is not a warning about a place.
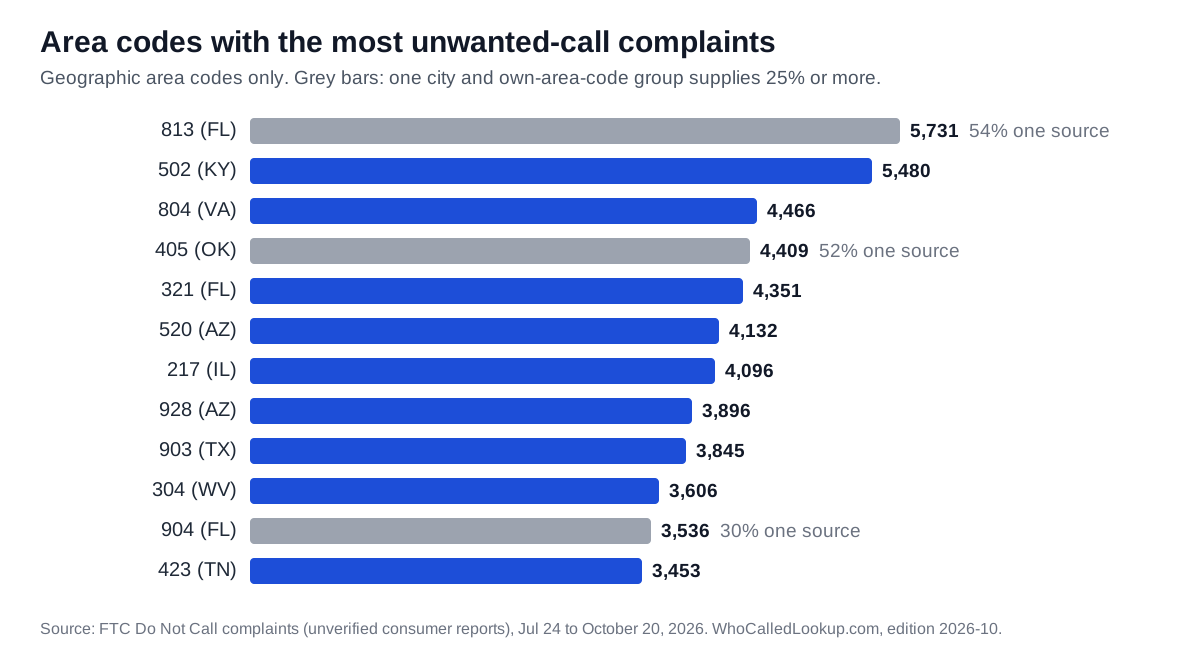
| Area code | State | Complaints | Different numbers | Same own code | Biggest single source |
|---|---|---|---|---|---|
| 813 | FL | 5,731 | 5,115 | 77.5% | 54.1% (no city given, own code 813) |
| 502 | KY | 5,480 | 4,959 | 29.7% | 11.4% (no city given, own code 502) |
| 804 | VA | 4,466 | 4,180 | 26.8% | 6.8% (no city given, own code 804) |
| 405 | OK | 4,409 | 4,187 | 85.3% | 51.9% (Oklahoma City, own code 405) |
| 321 | FL | 4,351 | 2,898 | 42.1% | 18.7% (Palm Bay, own code 321) |
| 520 | AZ | 4,132 | 3,643 | 34.2% | 11.6% (no city given, own code 520) |
| 217 | IL | 4,096 | 1,894 | 24.2% | 11.6% (Clinton, own code 217) |
| 928 | AZ | 3,896 | 3,608 | 46.8% | 16.4% (Flagstaff, own code 928) |
| 903 | TX | 3,845 | 3,490 | 34.7% | 7.3% (no city given, own code 903) |
| 304 | WV | 3,606 | 3,373 | 29.4% | 8.2% (no city given, own code 304) |
Complaints per 100,000 residents, by state
Counts are by the complainant's state and divided by Census Bureau 2024 population estimates. Because a few very active filers can move a small state, each row also shows the rate without the single largest city-and-own-code source. The monthly robocall report applies a stricter rule to its growth and per-resident rankings.
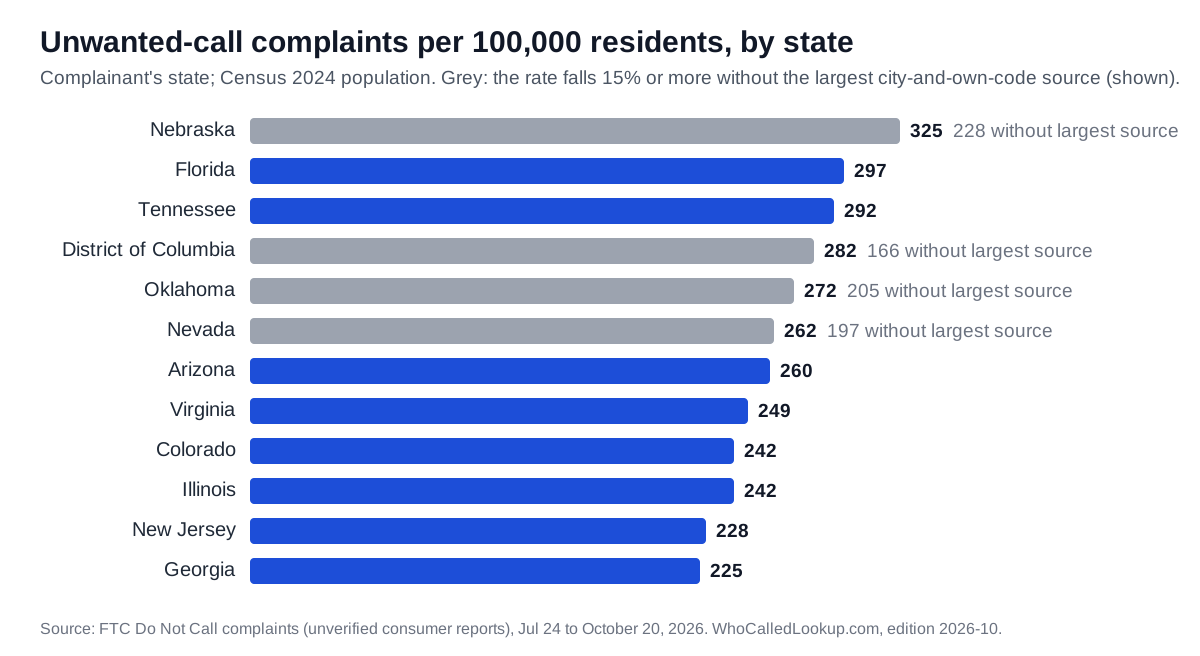
| State | Complaints | Per 100,000 | Without largest source | Largest source |
|---|---|---|---|---|
| Nebraska | 6,519 | 325 | 228 | 29.9% (Omaha, own code 402) |
| Florida | 69,489 | 297 | 280 | 5.9% (no city given, own code 813) |
| Tennessee | 21,091 | 292 | 271 | 7.3% (no city given, own code 865) |
| District of Columbia | 1,981 | 282 | 166 | 41.2% (no city given, own code 202) |
| Oklahoma | 11,155 | 272 | 205 | 24.8% (Oklahoma City, own code 405) |
| Nevada | 8,570 | 262 | 197 | 24.9% (Las Vegas, own code 702) |
| Arizona | 19,725 | 260 | 236 | 9.1% (no city given, own code 480) |
| Virginia | 21,972 | 249 | 232 | 7.1% (no city given, own code 703) |
| Colorado | 14,437 | 242 | 214 | 11.6% (no city given, own code 303) |
| Illinois | 30,787 | 242 | 229 | 5.6% (no city given, own code 630) |
What the calls were about
The FTC form asks the consumer to pick a subject. “Other” and “No subject given” together are 45.6% of complaints, so any ranking of scam types covers only the rest.
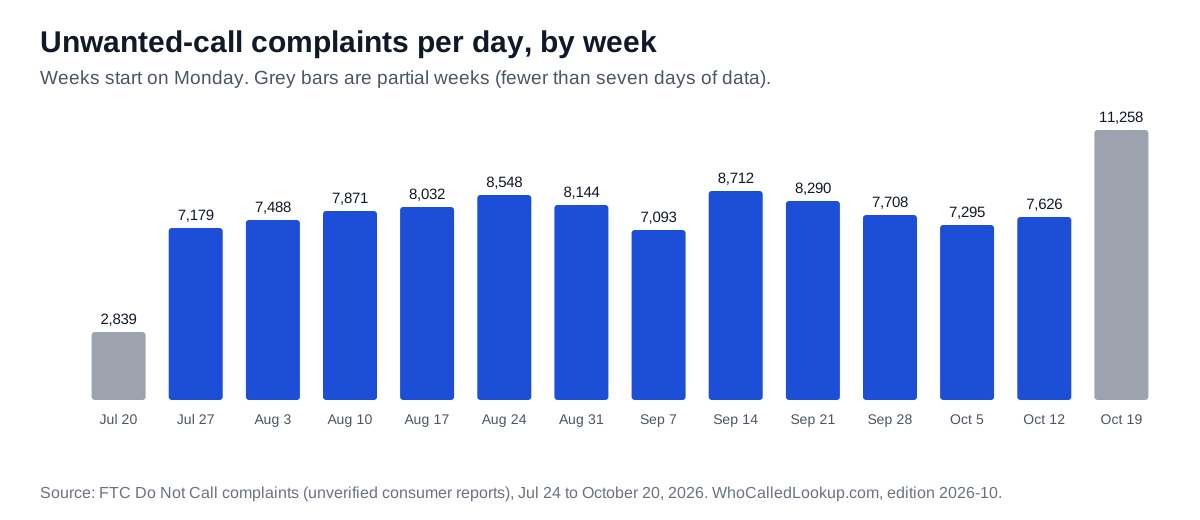
Complaints per day, week by week
Daily volume is steady rather than spiking: a typical full week in this window has between 7,093 and 8,712 complaints a day. The first and last bars are partial weeks.
Toll-free, local look-alike and one-off shares
Methodology
Source. The FTC publishes its Do Not Call reported calls data set each weekday. Each row holds the number that called, the date created, the time of the call, the consumer's city, state and area code, the subject and whether it was a recorded message. The FTC states that none of the information is verified. We import each daily file, drop exact duplicates, and aggregate; no complainant identity is stored beyond city and state.
Window. Complaints with a created date from July 24, 2026 to October 20, 2026(87 days with data). The first FTC file we hold starts on Jul 24. The FTC adds late-filed complaints, so a later pull of the same dates can be slightly higher. Editions are dated and are never rewritten; a new edition is published instead.
Definitions. A complaint is one row. An area code is the first three digits of the reported number; toll-free means 800, 833, 844, 855, 866, 877 or 888; “geographic” means an in-service NANPA code with a location, taken from the NANPA area-code report ( NANPA); “other” prefixes (for example Canadian, Caribbean or invalid numbers) are in the CSV but not in the geographic charts. “Same own code” compares the reported number's area code with the area code the consumer gave for their own phone. “Robocall” is the share of answered complaints where the consumer said the call was a recorded message or robocall. “Biggest single source” is the largest group of complaints from one city and one own area code; the name is shown only when that group has 50 or more complaints, and a blank city is shown as “no city given”.
States. The complainant's state, divided by Census Bureau Vintage 2024 population estimates (NST-EST2024). Puerto Rico and DC are included. Per-100,000 rates are rounded to whole complaints.
Call times. The hours file counts the 622,273 complaints with a recorded time. We leave out times of exactly 00:00 and 12:00, which the file uses when no time was given. The file does not say which time zone a time is in.
Limits. Complaints are consumer reports, not findings. A complaint names the number that displayed, and callers spoof and rotate numbers. Subjects are chosen by consumers. People who file are not a random sample of people who receive calls. Counts by area code and state describe reports, not where calls start or where scammers are.
Reproducibility. The numbers come from scripts/build-data-pack.ts, which reads our FTC import and writes one JSON edition; the page, CSVs and charts are all generated from it.
How to cite this
WhoCalledLookup, “US spam-call data pack, edition 2026-10” (FTC Do Not Call complaints, July 24, 2026 to October 20, 2026), https://whocalledlookup.com/data/spam-calls. More formats and a checklist for reporters are on the press page.
Related
FAQs
Do these numbers show which area codes the scammers are in?
No. A complaint names the number that displayed on the complainant's phone. Callers spoof numbers, rotate them and copy the complainant's own area code, so counts by area code show where reports point, not where calls start.
Can I reuse the charts and CSV files?
Yes, with a link back to this page and the edition name. The press page has ready-made citation lines. Please describe the figures as complaint counts, not as findings about who placed the calls.
Why does a later pull of the same dates show more complaints?
The FTC adds late-filed complaints to its daily files. This edition was pulled on October 27, 2026 and counts 683,247 complaints created from Jul 24 to Oct 20; our October 24 article on area codes to avoid cites 682,869 for the same dates, from the file as it stood that day.