Robocalls in New Hampshire
New Hampshire consumers have filed 4,699 unwanted-call complaints with the FCC against 4,260 different phone numbers between 2014-06-09 and 2026-10-22 — 0.5% of all state-attributed complaints, ranking 41 nationally. Complaints in the last 12 months are down 32% on the 12 months before that.
What New Hampshire residents are reporting
2,395 FTC Do Not Call complaints from New Hampshire since Jul 24. The most common named subject is debt reduction, at 29%. 79% of complainants who answered said the call was a recorded message.
Complaint subjects
- Other / unspecified1,00942%
- Debt reduction69829%
- Impostor (government, business, family)23610%
- Dropped call / no message1426%
- No subject given1255%
- Medical & prescriptions693%
- Home improvement & cleaning271%
When the calls come (as reported)
31% between 1pm and 4pm; 88% on weekdays, most on Tuesdays.
Week by week
842 complaints from New Hampshire in the last four weeks, down 5% on the four weeks before.
Neighbor spoofing in New Hampshire
28% of the calls New Hampshire residents reported showed the resident's own area code, and 25% showed a New Hampshire area code of any kind. 17% came from toll-free numbers. Most calls here don't pretend to be local, so a familiar area code is less of a warning sign than in states where spoofing dominates. How neighbor spoofing works.
What the caller ID showed
- The resident's own area code67428%
- Another New Hampshire area code00%
- Toll-free number39917%
- Out-of-state area code1,39958%
Area codes on the calls
- 603 (New Hampshire)59725%
- 8331074%
- 855663%
- 888613%
- 866592%
- 978562%
New Hampshire area codes
Each county is coloured by the area code that holds most of its phone prefixes. Overlay codes share one territory and one colour. Complaint counts are from New Hampshire residents since Jul 24.
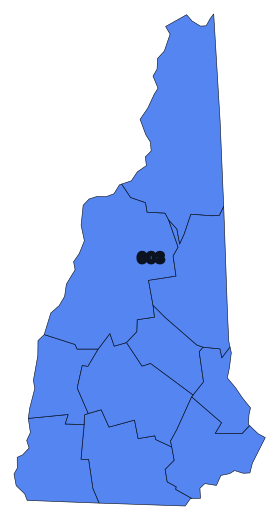
| Area code | Main city | Residents' complaints | Calls showing it |
|---|---|---|---|
| 603 | Manchester | 1,840 | 597 |
Likely campaigns reaching New Hampshire
8% of New Hampshire's FTC complaints in the campaign window match one of these statistical groupings: many numbers, the same complaint, the same pattern. They don't identify who is calling.
- Debt-relief robocall campaign on toll-free numbers82 complaints from New Hampshire (5% of the state's total)
- Debt-relief robocall campaign on local numbers64 complaints from New Hampshire (4% of the state's total)
- Impostor robocall campaign on local numbers1 complaints from New Hampshire (<1% of the state's total)
New Hampshire complaint volume by year
Unwanted-call complaints filed with the FCC by New Hampshire consumers each year. The shape of this curve reflects both actual call volume and how aware consumers are that the FCC complaint centre exists.
Area codes most reported in New Hampshire
The displayed area code of numbers reported by New Hampshire consumers — often, but not always, a local code, because spoofing favours familiar-looking numbers.
How the calls reached New Hampshire
- Prerecorded Voice
- 2,305
- Live Voice
- 1,526
- Abandoned Calls
- 497
- Text Message
- 323
- Autodialed Live Voice Call
- 41
- 1
- Wireless (cell phone)
- 2,427
- Wired
- 1,327
- Internet (VOIP)
- 945
Numbers New Hampshire residents reported this month
The numbers New Hampshire consumers reported most to the FTC's Do Not Call Registry in the last 30 days — 764 reports in all, 175 of them this week; 79% were described as robocalls. Click a number for what it was reported for.
- (775) 438-1723Impostor (government, business, family)10 from NH2026-10-15
- (207) 977-2134No subject given5 from NH2026-10-07
- (855) 994-1311Debt reduction3 from NH2026-10-17
- (855) 580-2560Debt reduction3 from NH2026-09-30
- (833) 766-1884Impostor (government, business, family)2 from NH2026-10-19
- (617) 802-9604Dropped call / no message2 from NH2026-10-15
- (833) 662-5670Debt reduction2 from NH2026-10-09
- (855) 357-2299Debt reduction2 from NH2026-10-09
- (877) 372-0903Debt reduction2 from NH2026-10-08
- (855) 883-0423Debt reduction2 from NH2026-10-01
- (201) 340-8962Dropped call / no message2 from NH2026-09-28
- (866) 771-5653Debt reduction2 from NH2026-09-27
- (855) 316-4622Debt reduction1 from NH2026-10-19
- (909) 377-4238Other / unspecified1 from NH2026-10-19
- (855) 580-2839Debt reduction1 from NH2026-10-18
What New Hampshire residents were called about this month
- Other / unspecified335
- Debt reduction232
- Impostor (government, business, family)62
- No subject given43
- Dropped call / no message36
- Medical & prescriptions19
- Home improvement & cleaning10
- Warranties & protection plans9
Numbers most reported to the FCC by New Hampshire consumers
Ranked by how many New Hampshire FCC complaints name them, limited to the last five years. A number appearing here means people in New Hampshire reported receiving calls that displayed it — not that its owner placed them.
Do Not Call protection in New Hampshire
New Hampshire formally adopted the FTC's National Do Not Call Registry as its own state list rather than running a separate one, so a single free registration at donotcall.gov covers you. State authorities can still enforce against telemarketers who ignore it, in addition to any federal penalty.
Whatever your state does, the federal National Do Not Call Registry applies, and the Telephone Consumer Protection Act gives you a private right of action against certain unlawful calls. Report unwanted calls at the FCC complaint centre and fraud at ReportFraud.ftc.gov. In New Hampshire, the New Hampshire Department of Justice also takes consumer complaints about scam calls.
Do Not Call classification per National Association of Attorneys General — history of Do Not Call. This is general information, not legal advice.
New Hampshire robocall FAQs
What are New Hampshire robocalls about right now?
Since 2026-07-24, New Hampshire residents filed 2,395 FTC Do Not Call complaints. The most common named subject was debt reduction, at 29% of complaints, and 79% of callers who answered said the call was a recorded message.
Are spam calls in New Hampshire using local numbers?
Often. 28% of the calls New Hampshire residents reported to the FTC showed the resident's own area code, and 25% showed a New Hampshire area code of any kind; 17% came from toll-free numbers. A local-looking number is no evidence the caller is local.
When do robocalls hit New Hampshire?
31% of complaints that give a call time describe calls between 1pm and 4pm local time as reported.
How many robocall complaints do New Hampshire residents file?
New Hampshire consumers have filed 4,699 unwanted-call complaints with the FCC against 4,260 distinct phone numbers, covering 2014-06-09 to 2026-10-22. That is 0.5% of all state-attributed complaints in the dataset, ranking New Hampshire 41 among US states and territories by complaint volume.
Does New Hampshire have its own Do Not Call list?
New Hampshire formally adopted the FTC's National Do Not Call Registry as its own state list rather than running a separate one, so a single free registration at donotcall.gov covers you. State authorities can still enforce against telemarketers who ignore it, in addition to any federal penalty.
Where do the calls reported in New Hampshire come from?
The FCC records the state the person filing the complaint was in, not where the caller was. Because caller ID is easily spoofed, a call reported in New Hampshire may have been placed from anywhere in the world and may have displayed a New Hampshire number that belongs to an uninvolved person. Area code alone tells you nothing reliable about a caller's location.
What kind of calls are reported most in New Hampshire?
Prerecorded Voice is the most-reported category in New Hampshire, accounting for 2,305 of the 4,699 complaints (49%). Live Voice is second with 1,526.
Complaint figures from the FCC Consumer Complaint Data Center, imported nightly, and FTC Do Not Call complaints (unverified consumer reports), published every weekday. The state recorded is the state the complainant filed from.